Technology and AI · 7 min read
Why learn ECG reading on real tracings
How real tracings differ from textbook drawings, which open datasets supply MedIQ's real ECG examples, who made their diagnostic labels and how to study a library record.
- Published
In this article
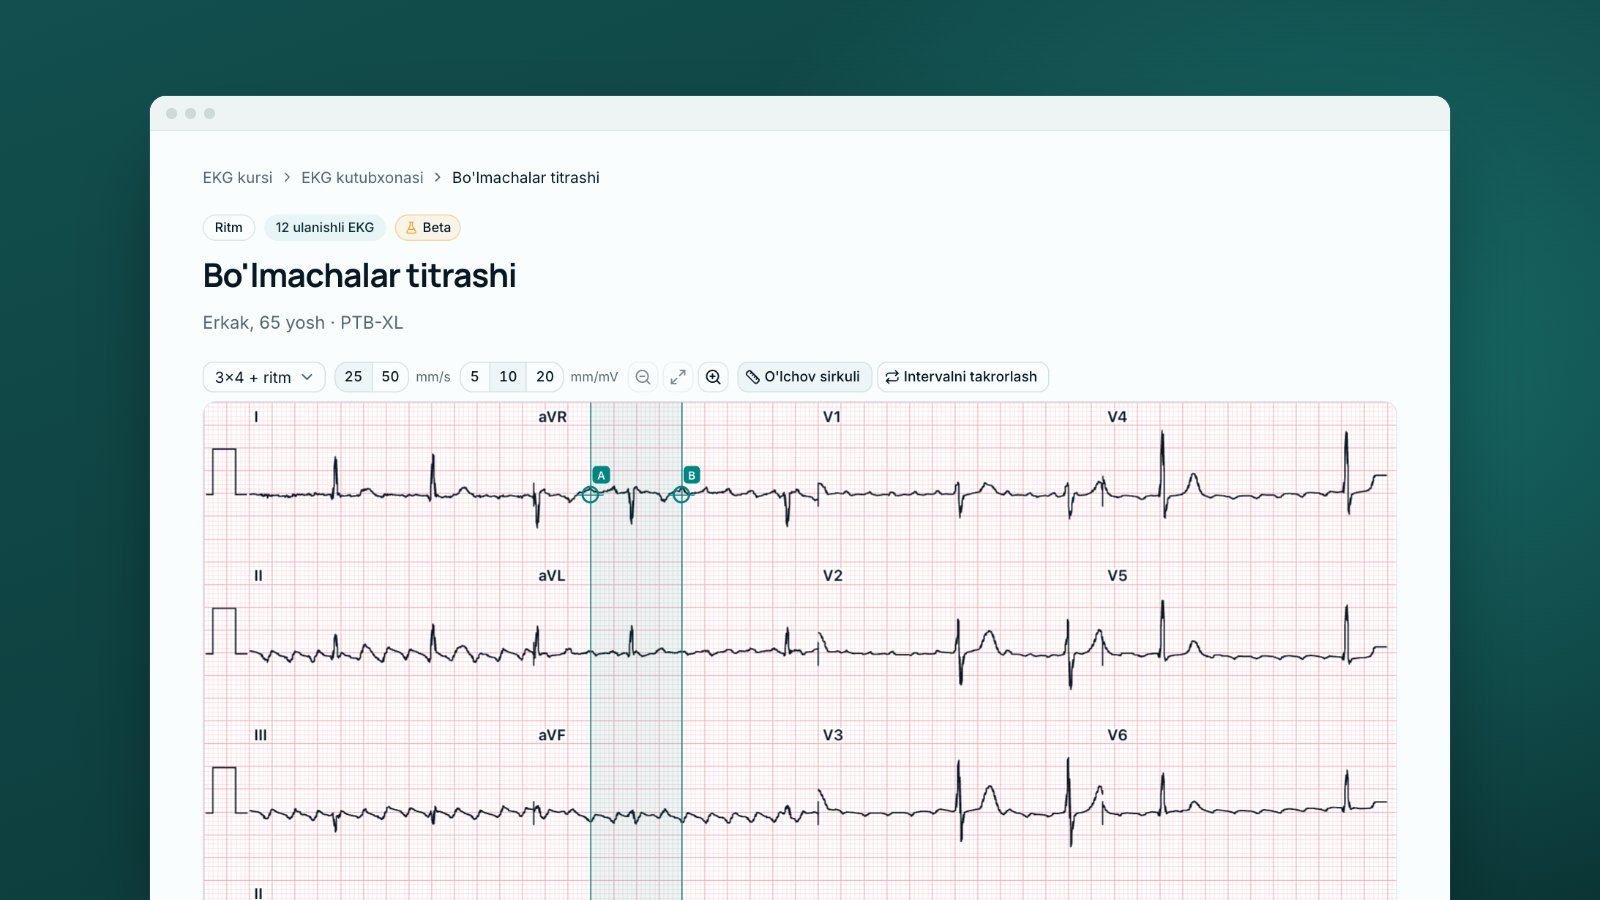
A textbook ECG is clean: a flat baseline, every wave in place, a QRS clearly normal or clearly wide. Your first ECG on call is different: the baseline drifts with breathing, the patient shivers, the QRS measures about 110 ms. Real ECG examples bridge that gap; drawings cannot.
Skill matters too. A systematic review and meta-analysis that included 78 studies found pooled pre-training accuracy of 42.0% in medical students, 55.8% in residents, 68.5% in practising physicians and 74.9% in cardiologists; gaps remained at every level, even after training [8].
Textbook drawing versus real ECG: four differences
A drawing shows one sign; a real tracing shows it among everything else.
Noise. In PTB-XL a technical expert graded signal quality: 77% of the data carry no quality flag, static noise is noted in about 15% of records and baseline drift in over 7% [2]. Most artefacts come from the patient (tremor, movement, breathing), and low-frequency interference appears as baseline wander [6]. An artefact can mimic ventricular tachycardia or atrial fibrillation [6].
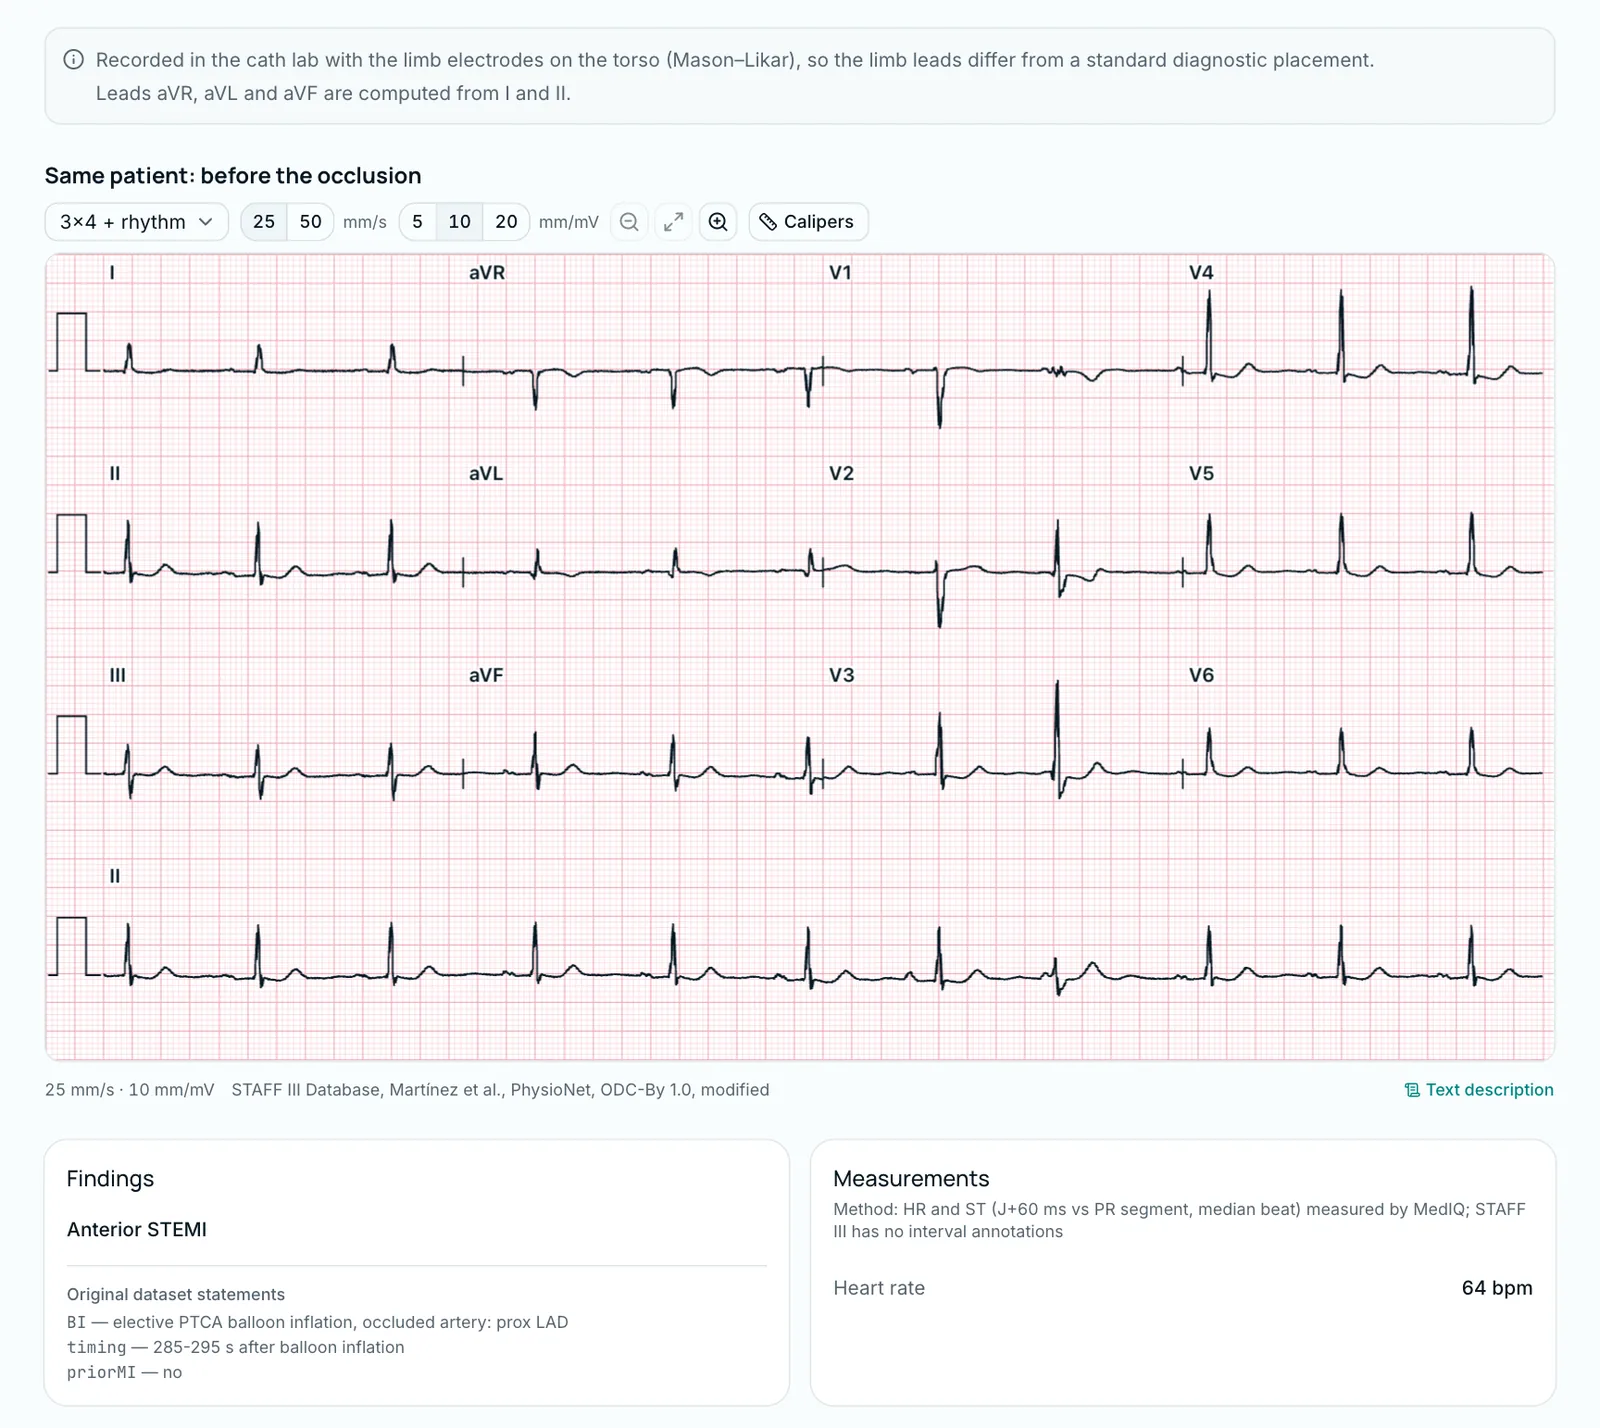
Recording conditions. Moving the limb electrodes onto the torso (Mason–Likar placement) shifts the QRS axis rightwards: R-wave amplitude falls in I and aVL and rises in II, III and aVF. Such a tracing is not equivalent to a standard ECG, so the electrode position is noted and taken into account [6].
Normal variants. The 2017 international criteria for athletes' ECGs class several findings as adaptations to training: sinus bradycardia (30/min or faster), sinus arrhythmia, first-degree AV block (PR 200–400 ms), incomplete right bundle branch block, early repolarisation and isolated voltage criteria. In an athlete without symptoms or a significant family history they need no further tests [7]. In the MedIQ library, a 52-year-old man's ECG has a rate of 54/min, and its dataset statements include "NORM — normal ECG" and "SBRAD — sinus bradycardia". The dataset does not say he is an athlete; the example only shows that one tracing can be labelled both normal and bradycardic.
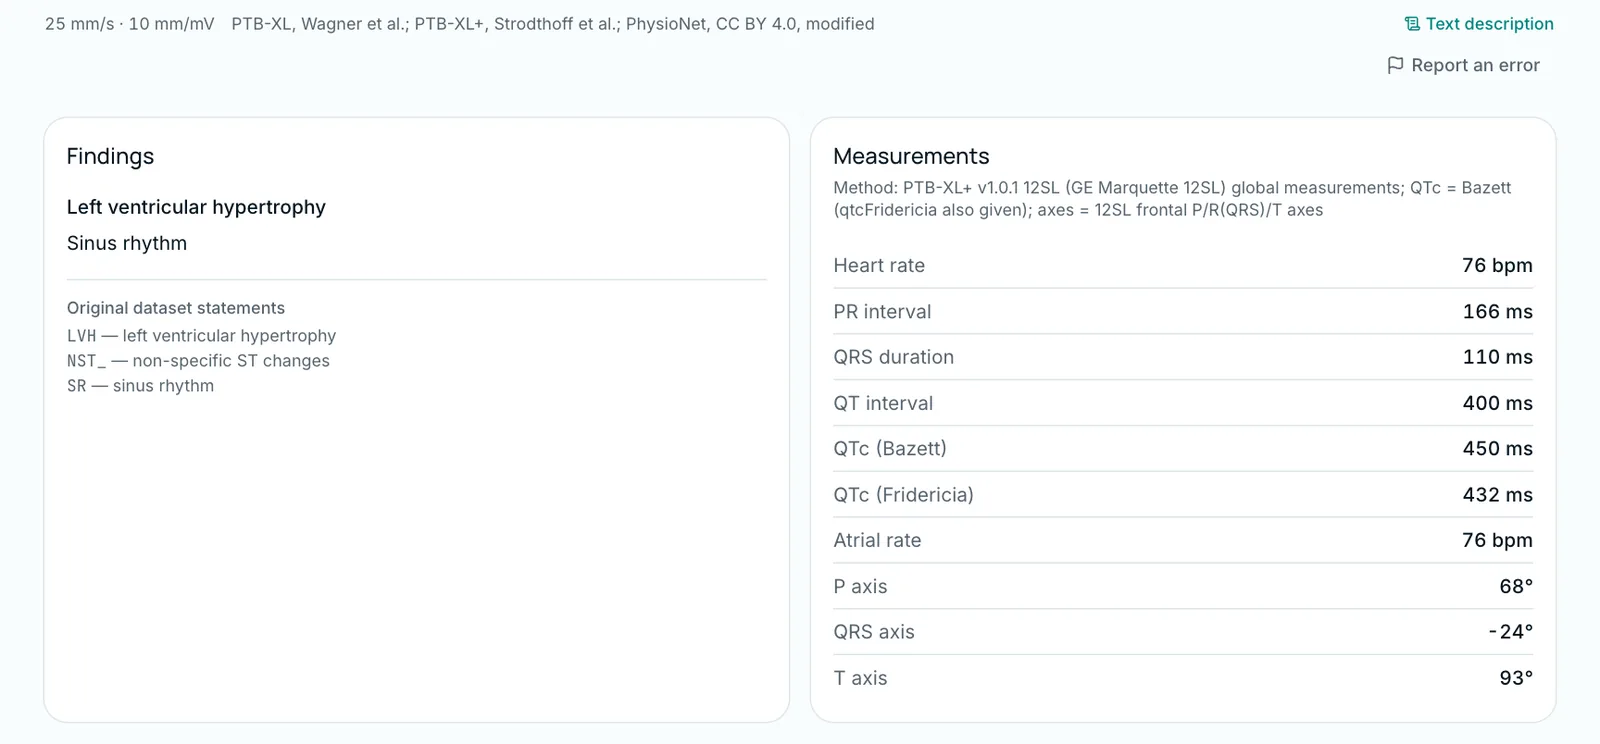
Borderline values. Sex, age and physical activity affect QRS voltage, and all ECG criteria for left ventricular hypertrophy correlate poorly with wall thickness and mass on imaging [7]. Another library ECG, from a 74-year-old man, has a Sokolow–Lyon index of 42.6 mm, above the 35 mm (3.5 mV) threshold [7], while the Cornell criterion is not met: two criteria give different answers on the same tracing.
Where the real ECG examples come from: open datasets
All real ECGs in MedIQ come from PhysioNet, an open resource backed by the US National Institutes of Health (NIH) that gives free access to well-characterised physiological recordings [1]. The course uses five; the main four are:
| Dataset | Contents | Source of labels | Licence |
|---|---|---|---|
| PTB-XL | 21,799 ten-second 12-lead ECGs from 18,869 patients (version 1.0.3) [2] | Up to two cardiologists [2] | CC BY 4.0 |
| STAFF III | ECGs of 104 patients during elective coronary angioplasty [3] | Procedure record: which artery the balloon occluded, and when [3] | ODC-By 1.0 |
| MIT-BIH Arrhythmia Database | 48 half-hour two-channel recordings from 47 people [4] | Two cardiologists independently reviewed the automatic labels of every recording; disagreements settled by consensus [4] | ODC-By 1.0 |
| LUDB | 200 ten-second 12-lead ECGs [5] | Cardiologists marked P, QRS and T boundaries in every lead; each record has a diagnosis [5] | ODC-By 1.0 |
The fifth is the CU Ventricular Tachyarrhythmia Database, with single-lead strips of ventricular tachyarrhythmias. Both licences allow reuse with credit, so every real strip carries a source line such as "STAFF III Database, Martínez et al., PhysioNet, ODC-By 1.0, modified". "Modified" means that 10-second segments were cut, the baseline offset was removed and some records were resampled. The full list is on the course page "Sources and licences"; the ECG course article gives an overview.
Who made the diagnosis
MedIQ does not change a dataset's label or replace it with its own diagnosis: in every dataset except STAFF III, the diagnosis shown is the dataset's own label, quoted unchanged in the "Original dataset statements" block, for example "LVH — left ventricular hypertrophy". Its origin varies:
- PTB-XL. Cardiologists wrote 67% of the initial reports and 31% were the machine's automatic interpretation; the authors flag the records a cardiologist validated [2]. MedIQ took only cardiologist-validated PTB-XL records.
- STAFF III. The label is a procedure record, not a reading: which artery was occluded and when the balloon was inflated [3]. A STAFF III record's title (such as "Anterior STEMI") is therefore MedIQ's teaching name for the pattern the documented occlusion produced.
- MIT-BIH. Beat labels were generated automatically, then two cardiologists independently reviewed every recording and corrected them [4].
Labels can be wrong, so ECGs whose dataset label did not hold up on measurement were left out. The "Interpretation" text was written and checked by MedIQ AI: each batch went to two independent AI reviewers and an AI adjudicator. The course is in Beta: no physician has reviewed it yet.
What the "Model" badge means
Some conditions are rare in open datasets, so the course also uses synthetic strips. They always carry the "Model" badge and the line "Synthetic ECG, MedIQ model"; the tooltip reads "A synthetic strip generated by a model — not a patient's ECG."
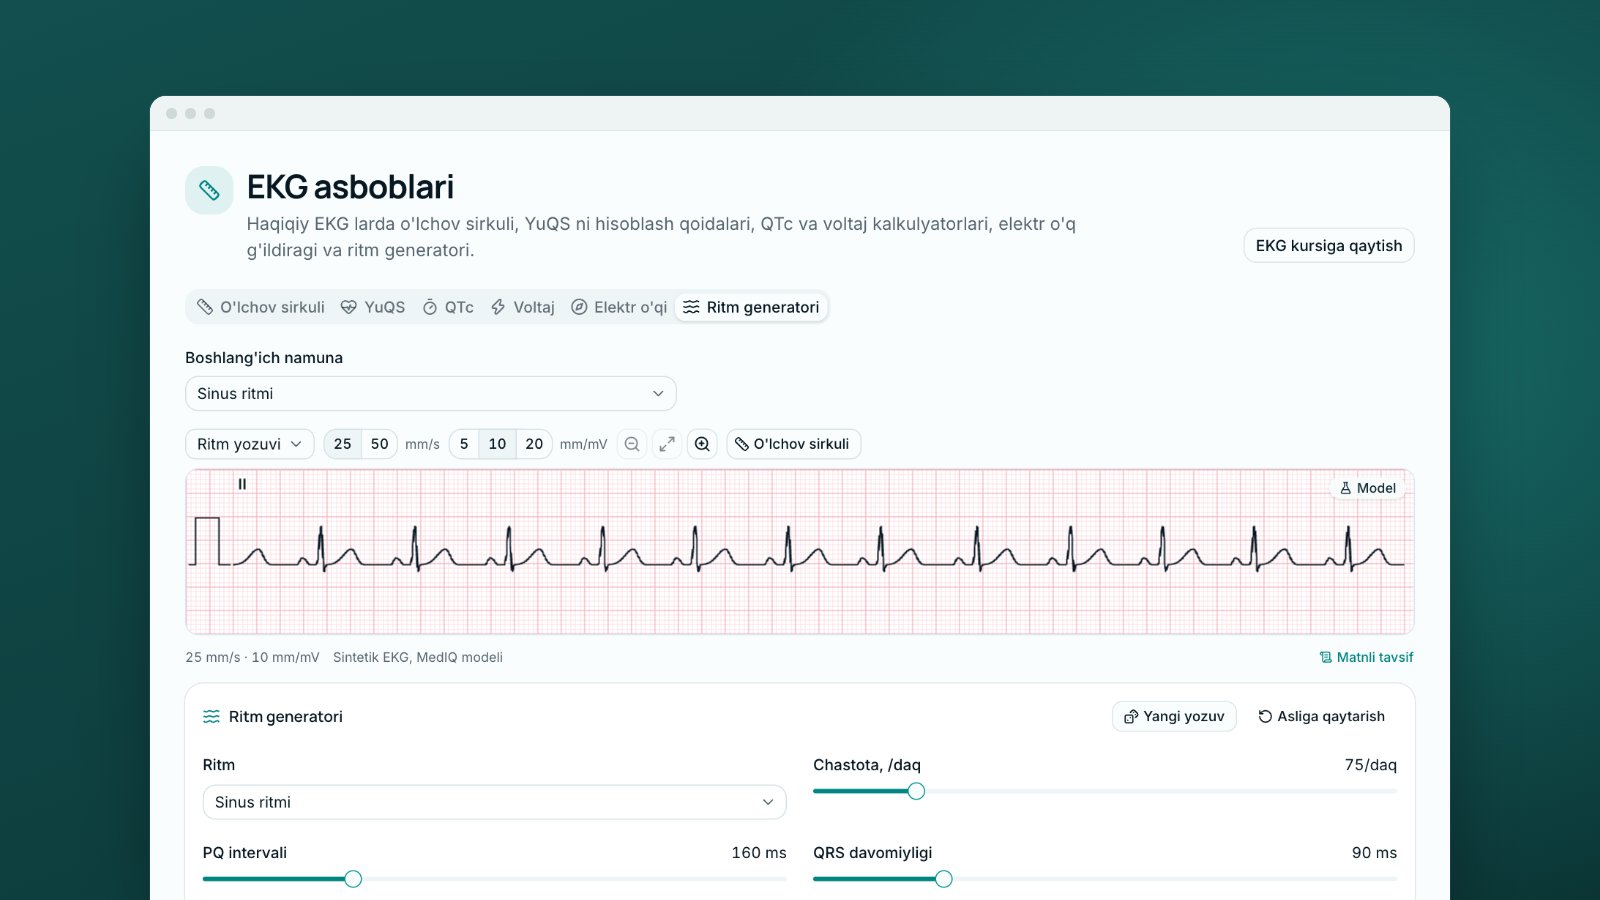
A model strip is a living textbook drawing: the pattern is clean, and in the rhythm generator you change a setting and watch the ECG change (see the article on arrhythmias). A real tracing teaches you to find that pattern among noise, variants and borderline values. You need both: learn the pattern on the model, then practise recognising it on real ECGs.
Worked example: studying one library record
Open "Anterior STEMI" in the library (a woman aged 74, STAFF III). The order matters:
- Read it yourself first. The title names the main finding, but leave the cards closed: find for yourself where the ST segment rises and where it falls, and write your conclusion in the systematic order.
- Check the recording conditions. The page notes a cath-lab recording with the limb electrodes on the torso (Mason–Likar). Because of that placement, its limb leads are not equivalent to standard ones [6].
- Measure. Check the ST deviation with the calipers (how to measure). STAFF III has no interval annotations, so MedIQ measured the rate and the ST deviation itself, as the "Method" line on the "Measurements" card says. Write down your values and check them at step 6 against the "Interpretation": at J+60 ms, ST elevation of 7.2 mm in V2 and 8.0 mm in V3, and depression of 2.7 mm in III and 2.4 mm in aVF.
- Read the label. "Original dataset statements": "BI — elective PTCA balloon inflation, occluded artery: prox LAD", recorded 285–295 seconds after inflation. It records a procedure, not an opinion: the proximal left anterior descending artery (LAD) was occluded [3]. The ST elevation comes from an acute coronary occlusion, but this is acute ischaemia during a planned, temporary occlusion, not a spontaneous infarction [3].
- Compare. The page also shows her ECG before the occlusion; compare the two lead by lead.
- Read the interpretation last. Check your conclusion against it and note what you missed.
How to practise this on MedIQ
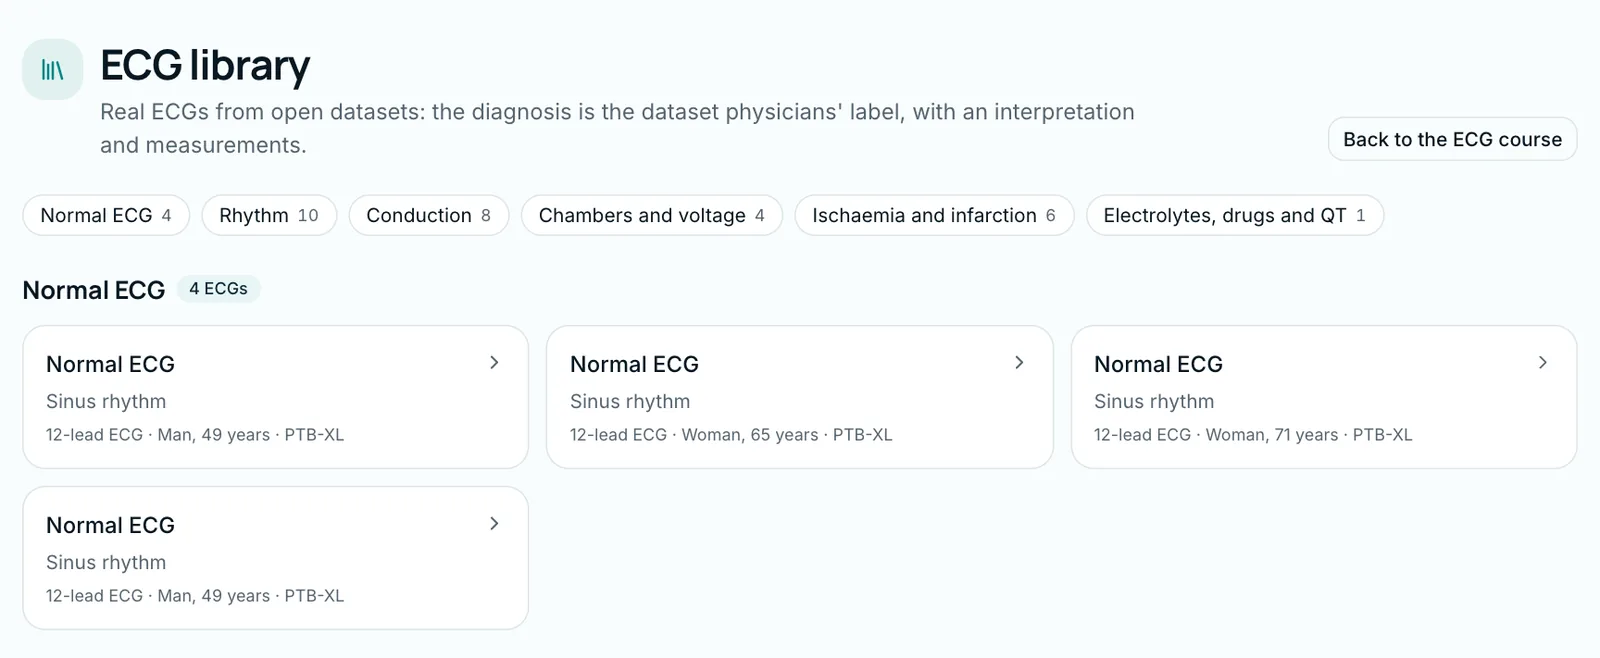
The ECG library holds over 30 real 12-lead ECGs with interpretations, in six sections: "Normal ECG", "Rhythm", "Conduction", "Chambers and voltage", "Ischaemia and infarction" and "Electrolytes, drugs and QT". The library is for study, so the interpretation is open. Most of the course's more than 190 real ECGs sit in lessons and drills; drill ECGs are kept out of the library, so their answers cannot be looked up in advance. Real noise appears on PTB-XL tracings in the lesson "Artefacts and lead reversals".
If you find a mistake, press "Report an error": a confirmed error hides the item until it is fixed. More on the ECG course page.
This article is for education: decisions about a real patient follow local protocols and the supervising doctor.
Sources
- 1.Goldberger AL, Amaral LAN, Glass L, Hausdorff JM, Ivanov PCh, Mark RG, et al. PhysioBank, PhysioToolkit, and PhysioNet: components of a new research resource for complex physiologic signals. Circulation. 2000;101(23):e215–e220. doi.org/10.1161/01.CIR.101.23.e215
- 2.Wagner P, Strodthoff N, Bousseljot RD, Kreiseler D, Lunze FI, Samek W, et al. PTB-XL, a large publicly available electrocardiography dataset. Sci Data. 2020;7:154. Dataset v1.0.3: PhysioNet, 2022. doi.org/10.1038/s41597-020-0495-6
- 3.Martínez JP, Pahlm O, Ringborn M, Warren S, Laguna P, Sörnmo L. The STAFF III database: ECGs recorded during acutely induced myocardial ischemia. Comput Cardiol. 2017;44. Data: STAFF III Database (version 1.0.0), PhysioNet. doi.org/10.22489/CinC.2017.266-133
- 4.Moody GB, Mark RG. MIT-BIH Arrhythmia Database (version 1.0.0). PhysioNet. 2005. doi.org/10.13026/C2F305
- 5.Kalyakulina AI, Yusipov II, Moskalenko VA, Nikolskiy AV, Kosonogov KA, Osipov GV, et al. LUDB: a new open-access validation tool for electrocardiogram delineation algorithms. IEEE Access. 2020;8:186181–186190. doi.org/10.1109/ACCESS.2020.3029211
- 6.García-Niebla J, Llontop-García P, Valle-Racero JI, Serra-Autonell G, Batchvarov VN, Bayés de Luna A. Technical mistakes during the acquisition of the electrocardiogram. Ann Noninvasive Electrocardiol. 2009;14(4):389–403. doi.org/10.1111/j.1542-474X.2009.00328.x
- 7.Drezner JA, Sharma S, Baggish A, Papadakis M, Wilson MG, Prutkin JM, et al. International criteria for electrocardiographic interpretation in athletes: consensus statement. Br J Sports Med. 2017;51(9):704–731. doi.org/10.1136/bjsports-2016-097331
- 8.Cook DA, Oh SY, Pusic MV. Accuracy of physicians' electrocardiogram interpretations: a systematic review and meta-analysis. JAMA Intern Med. 2020;180(11):1461–1471. doi.org/10.1001/jamainternmed.2020.3989
Tags
- real ECG
- real ECG examples
- ECG library
- PTB-XL
- PhysioNet
- ECG artefacts
- ECG interpretation
About the author
MedIQ Editorial
Editorial team for medical education
MedIQ Editorial is the team of clinicians and medical-education specialists who prepare the platform's learning content. Articles are based on current clinical guidelines (WHO, FIGO, ACOG, RCOG, NICE, ESHRE) and peer-reviewed research; sources are listed at the end of every article.