Clinical practice · 8 min read
How to read an ECG systematically: the same order every time
How to read an ECG in 10 steps, from context and recording quality to the conclusion, with adult normal values and a worked example on a normal 12-lead ECG.
- Published
In this article
- Why an order helps: a first impression is not enough
- How to read an ECG: 10 steps and adult normal values
- Steps 1–2: context and quality
- Steps 3–5: rate, rhythm, axis
- Step 6: intervals
- Steps 7–9: P, QRS, ST, T and U
- Step 10: comparison and conclusion
- Worked example: a normal ECG in 10 steps
- How to practise on MedIQ
Atrial fibrillation jumps out at first glance. You have your diagnosis, you stop reading, and the ST elevation in V2–V4 goes unnoticed. An error like this comes not from an unknown pattern but from a part of the tracing nobody looked at.
Here is a 10-step order for any 12-lead ECG, with adult normal values and a worked example.
Why an order helps: a first impression is not enough
In a meta-analysis of 78 studies, accuracy before training was 42% in medical students and 74.9% in cardiologists [1]; see our ECG course article.
Experienced readers often recognise an ECG at a glance; beginners have not yet seen enough tracings. In an experiment by Ark and colleagues, 48 psychology students new to ECGs learned to diagnose 10 cardiac conditions [2]. The group told to "identify all features first" reached 42% accuracy, the group told to "trust your first impression" 41%, and the two groups that combined both, explicitly or implicitly, 56% and 53% [2].
So a systematic order does not replace the first impression; it checks it. Sibbald and colleagues had 44 clinicians, novice to expert, read 10 ECGs and then check their readings against a checklist: all levels found and fixed mistakes, and novices gained most [3]. Our clinical reasoning article covers both modes of thinking. The rule: note your first impression, then finish every step, even after an obvious finding.
How to read an ECG: 10 steps and adult normal values
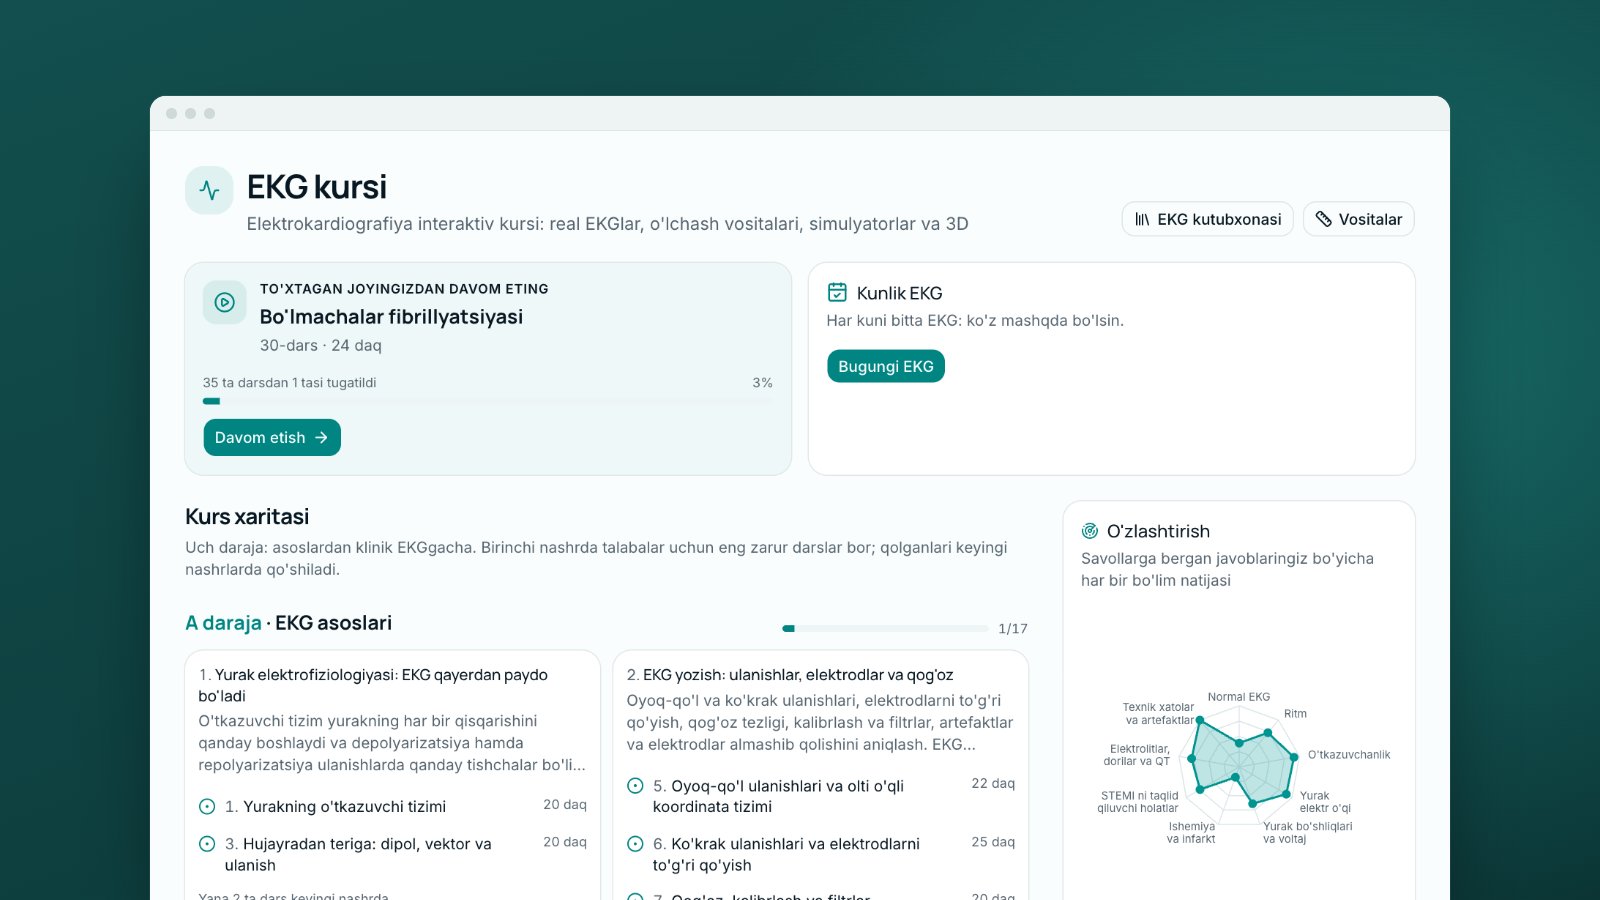
Textbook and guideline orders differ slightly, and so do some limits, such as rate. The 2022 Brazilian Society of Cardiology guideline, for example, reports rhythm and rate, P and PR, axis, QRS, then repolarisation [4]. What matters is one order, every time. The MedIQ ECG course (lesson 15) teaches this order; the table gives the source of each normal value:
| No. | Step | What you check | Adult normal |
|---|---|---|---|
| 1 | Context | Patient, reason for the ECG, previous ECG | — |
| 2 | Quality | Calibration, speed, filters, artefacts, electrodes | 1 mV = 10 mm [4] |
| 3 | Rate | Atrial and ventricular rate | 50–99/min awake [4] |
| 4 | Rhythm | Sinus? Regular? P before each QRS? | P upright in I, II, aVF [4] |
| 5 | Axis | Frontal QRS axis | −30° to +90° [4] |
| 6 | Intervals | PR, QRS, QT, QTc | PR 120–200 ms; QRS < 120 ms [4]; QTc up to 450 ms (men), 460 ms (women) [5] |
| 7 | P and QRS | P size; QRS voltage, Q waves, R progression | P ≤ 2.5 mm and ≤ 110 ms; transition V3–V4 [4] |
| 8 | ST segment | Deviation from the PR segment | at PR level (± 0.5 mm); higher elevation limits in V1–V3 [4] |
| 9 | T and U waves | Direction, shape, U wave | T inverted in aVR; may be inverted in V1 and III [4] |
| 10 | Comparison and conclusion | What is new, conclusion, urgency | Standard statements [6] |
The rate limits in the table are the Brazilian guideline's; the MedIQ course drills use 60–100/min.
Steps 1–2: context and quality
The same ECG means one thing in a 20-year-old athlete and another in a 70-year-old with chest pain, so read the clinical details first. Then check the calibration pulse and the filters: in adults the high-frequency cut-off should be at least 150 Hz and the low-frequency cut-off 0.05 Hz [4]. Negative waves in lead I with positive waves in aVR suggest swapped arm electrodes. The main differential is dextrocardia, where P, QRS and T are negative in V6 as well [4].
Steps 3–5: rate, rhythm, axis
At 25 mm/s a large box is 0.2 s and a small box 0.04 s, so the rate is 300 ÷ the number of large boxes between two R waves, or 1500 ÷ the number of small boxes. In an irregular rhythm such as atrial fibrillation, count the QRS complexes in 6 seconds and multiply by 10 [4].
Sinus rhythm is defined by the P wave, upright in I, II and aVF [4]. Whether every P is followed by a QRS and the PR stays constant is a separate question about AV conduction: sinus rhythm can coexist with AV block [4]. For the axis, look at I and aVF: a mainly positive QRS in both means 0° to +90°. If I is positive and aVF negative, look at II: a positive QRS there means the axis is not beyond −30°, so it is still normal [4].
Step 6: intervals
Machines measure P and QRS globally, from the earliest onset to the latest offset in any of the 12 leads, so their values can exceed a single-lead reading [4][7], and a doctor must check them [4].
The QT runs from QRS onset to the end of the T wave and is corrected for rate, most often with Bazett's formula: QTc = QT / √RR (RR in seconds). It is less reliable below 60 or above 90/min, where the Framingham or Hodges formula is recommended [4]. Postema and Wilde note that Bazett works best at 60–100/min [5]. In long QT syndrome, congenital or acquired, a QTc of 500 ms or more carries a markedly higher risk of arrhythmia [5]. Limits vary by source: the Brazilian guideline accepts up to 470 ms in women [4].
Steps 7–9: P, QRS, ST, T and U
QRS voltage is typically 5–20 mm in the limb leads and 10–30 mm in the chest leads, and the R wave grows from V1 to V6 [4]. Look here for pathological Q waves and signs of bundle branch block. If the ST segment deviates from the PR level, note the leads. The guideline takes ST elevation of at least 1 mm in two contiguous limb or left chest leads as a sign of injury. In V1–V3 the limits are higher: ≥ 1.5 mm in women, ≥ 2 mm in men aged 40 or older and ≥ 2.5 mm in men under 40 [4]. Judge smaller elevations in the clinical context too. In a normal ECG the T wave is inverted in aVR, and a U wave follows the direction of the T wave [4].
Step 10: comparison and conclusion
What is new compared with the previous ECG? Write the conclusion: rhythm and rate, axis, then the findings by importance. Part II of the 2007 recommendations of the American Heart Association (AHA), the American College of Cardiology Foundation (ACCF) and the Heart Rhythm Society (HRS) offers students, teachers and anyone who reads ECGs a shared list of diagnostic statements, including ones for comparing tracings [6]. Last, decide urgency: report a dangerous finding to the responsible doctor at once.
Worked example: a normal ECG in 10 steps
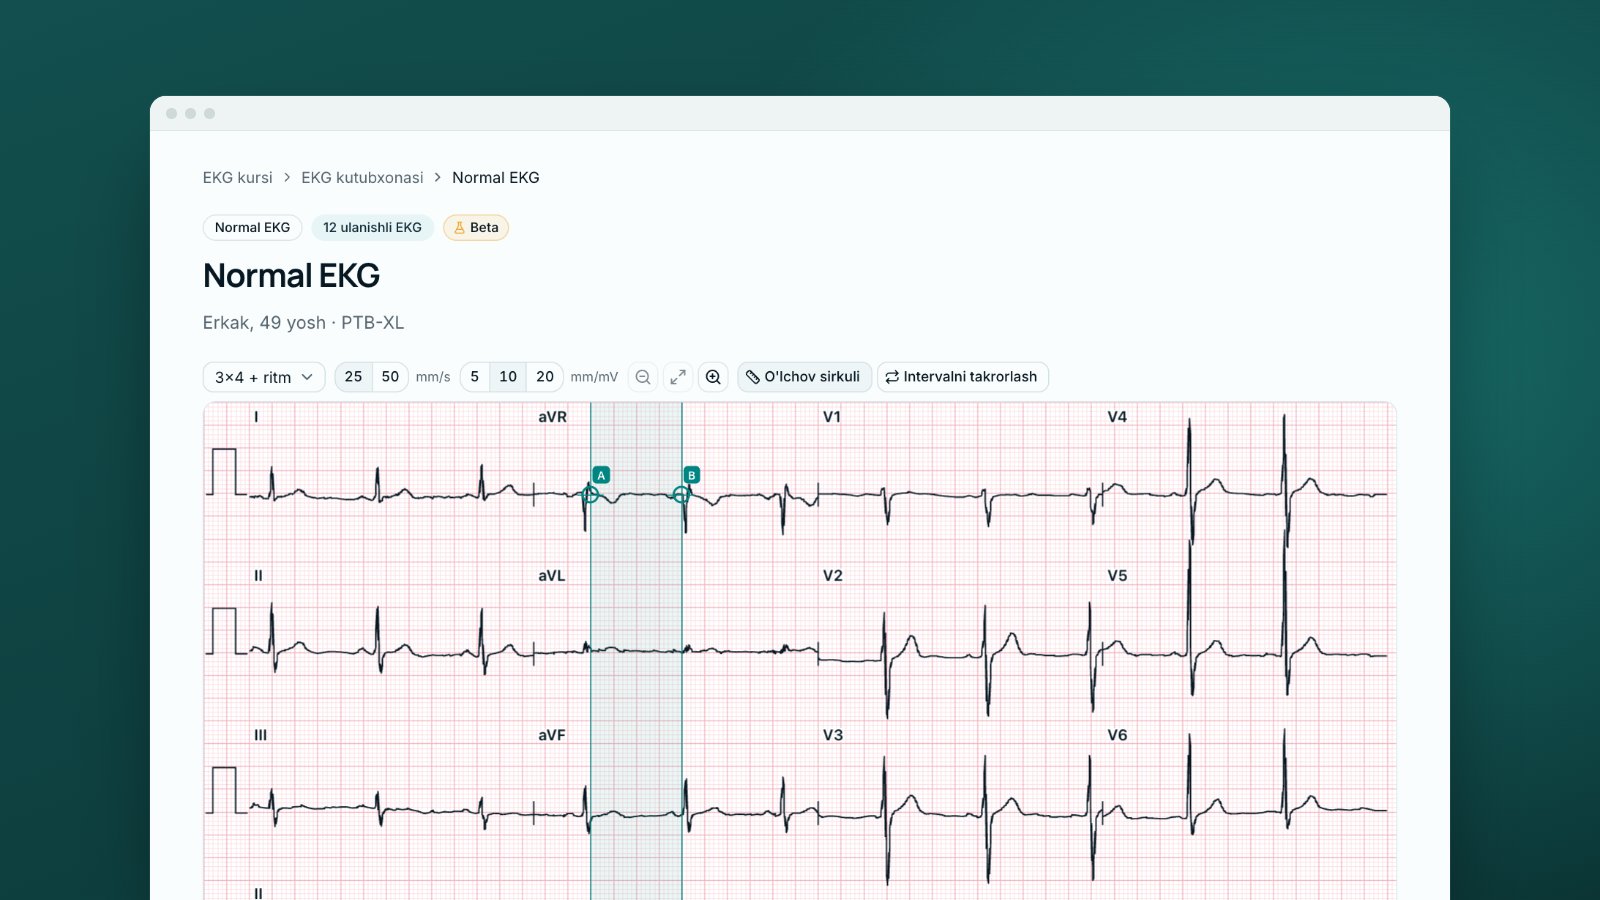
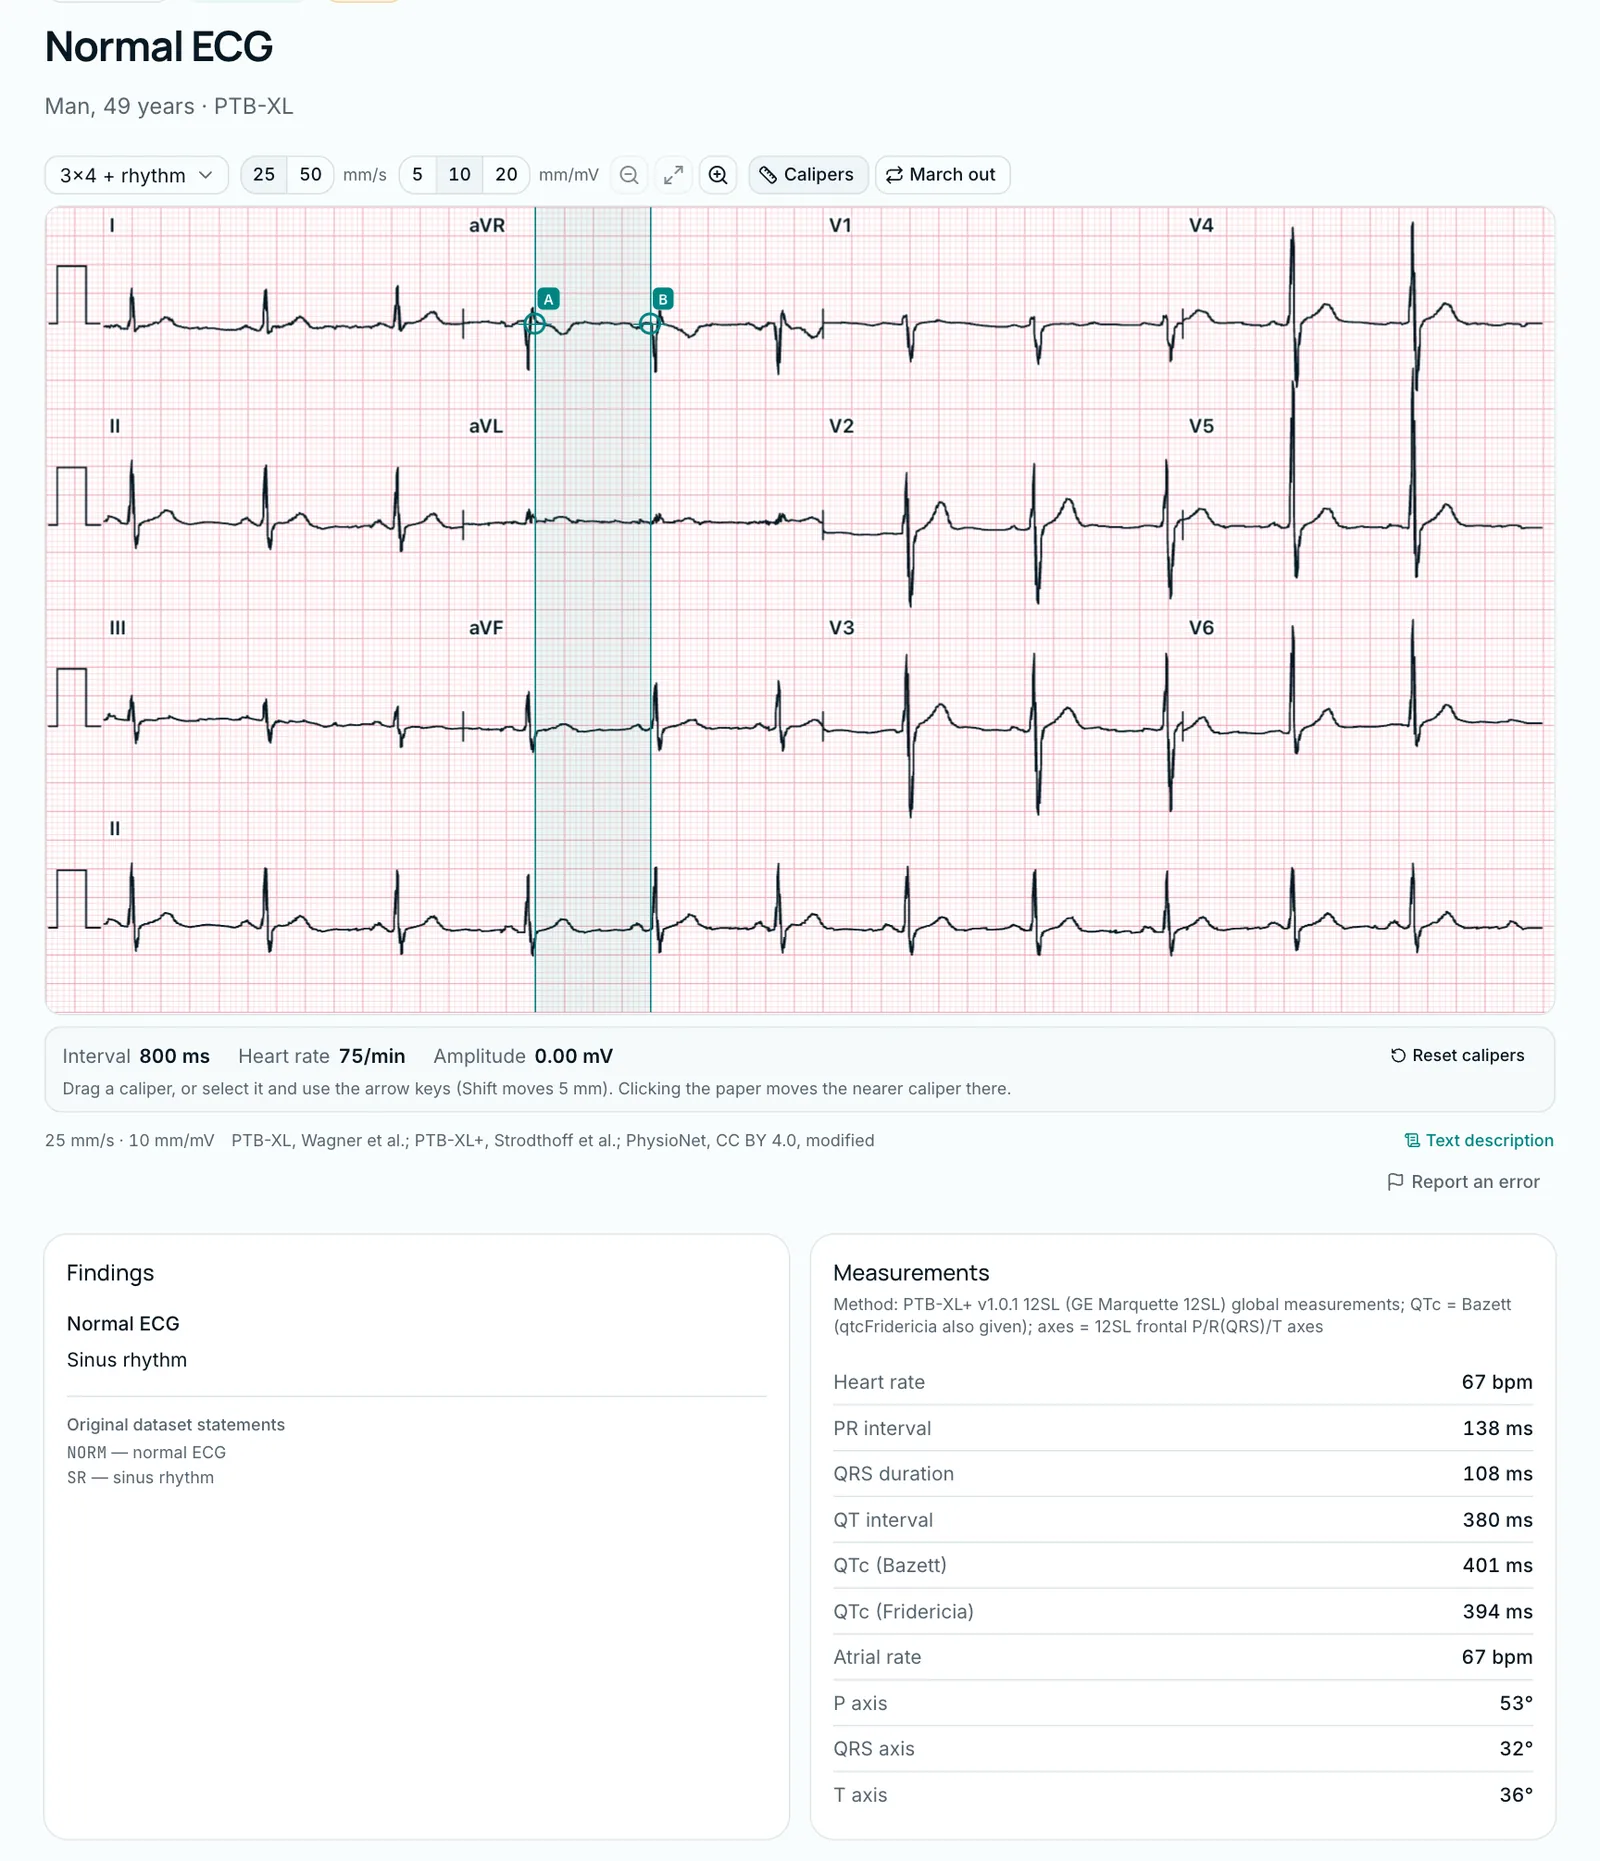
This MedIQ library tracing comes from a 49-year-old man in PTB-XL, a dataset annotated by up to two cardiologists [8]. This record was validated by a cardiologist, and its label is "NORM — normal ECG". The course overview walked through this ECG briefly; here every step gets its own check. The numbers are the machine measurements shown on the library's "Measurements" card (PTB-XL+, GE Marquette 12SL algorithm).
- Context: no clinical details, no previous ECG.
- Quality: 25 mm/s, 10 mm/mV; P upright in I and inverted in aVR, so the arm electrodes are not swapped.
- Rate: 67/min; RR = 60,000 ÷ 67 ≈ 896 ms, about 22 small boxes.
- Rhythm: one P wave before each QRS, upright in I, II and aVF (P axis +53°): sinus rhythm, regular.
- Axis: +32°, normal.
- Intervals: PR 138 ms, QRS 108 ms, QT 380 ms. The rate is within 60–90/min, so Bazett suits here [4]. Check the QTc: 380 ÷ √0.896 ≈ 380 ÷ 0.947 ≈ 401 ms (Bazett); Fridericia gives 394 ms. Both are normal [5].
- P and QRS: normal P wave; no pathological Q waves, rS in V1, transition near V3–V4, normal voltage.
- ST: isoelectric.
- T: upright in I, II and V2–V6, inverted in aVR.
- Conclusion: "Sinus rhythm, rate 67/min. Normal ECG." It matches the dataset label.
The QRS of 108 ms is a global value; calipers in one lead may give slightly less [4].
How to practise on MedIQ
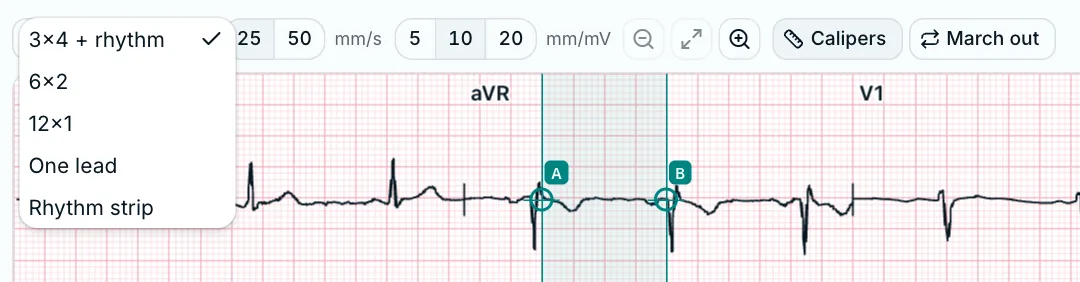
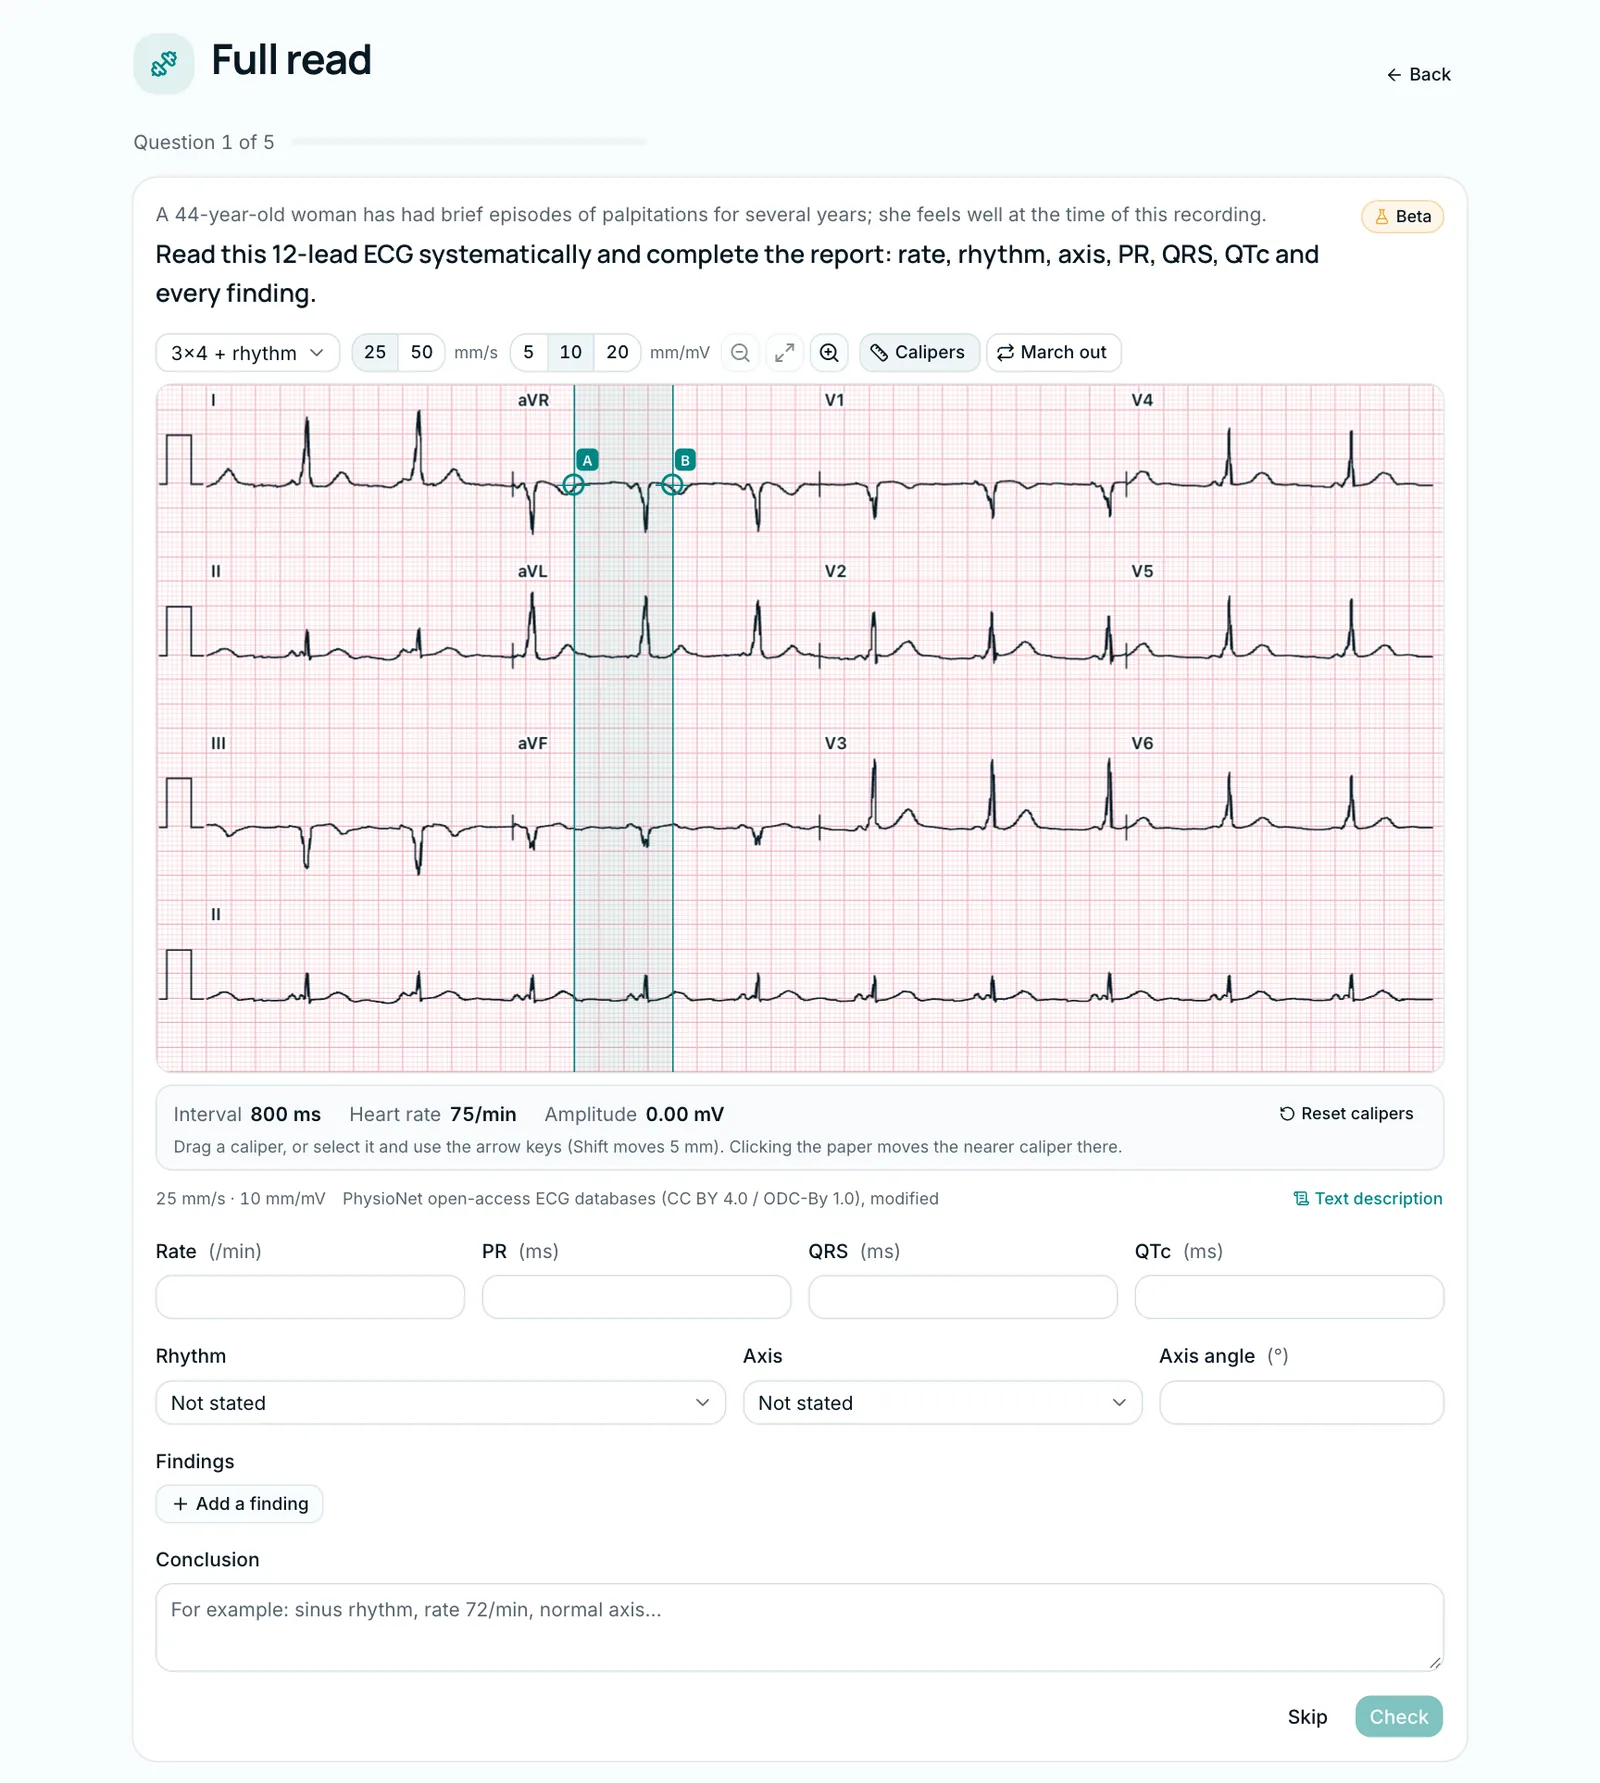
Lesson 15 of the MedIQ ECG course, "The 10-step ECG reading", teaches this order. Every tracing in the course opens in the ECG viewer with "Layout" (3×4 + rhythm, 6×2, 12×1, one lead, rhythm strip), "Paper speed" (25 or 50 mm/s), "Gain" (5, 10 or 20 mm/mV), "Calipers" and "March out". The ECG library holds over 30 real ECGs, and most of their interpretations follow nearly this order: rate, rhythm, axis, intervals, P, QRS, ST–T, conclusion.
In the "Full read" drill you read five 12-lead ECGs yourself: you fill in rate, rhythm, PR, QRS, QTc, axis and findings in the "ECG report" form. Straight after checking, you see a mark for each field, the expected findings and an explanation. A rule-based grader marks it, not AI; the free-text conclusion is not graded. Missing a critical finding, such as STEMI or complete heart block, caps the score at 40%. The drill also includes Level B clinical ECGs and synthetic "Model" tracings.
The course is in Beta: checked by MedIQ AI, not yet by a physician, and a real ECG's diagnosis is the dataset's own label. A short overview is on the ECG course page. This article is educational; decisions about real patients follow local protocols and the responsible doctor.
Sources
- 1.Cook DA, Oh SY, Pusic MV. Accuracy of physicians' electrocardiogram interpretations: a systematic review and meta-analysis. JAMA Intern Med. 2020;180(11):1461–1471. doi.org/10.1001/jamainternmed.2020.3989
- 2.Ark TK, Brooks LR, Eva KW. Giving learners the best of both worlds: do clinical teachers need to guard against teaching pattern recognition to novices? Acad Med. 2006;81(4):405–409. doi.org/10.1097/00001888-200604000-00017
- 3.Sibbald M, de Bruin AB, van Merrienboer JJ. Finding and fixing mistakes: do checklists work for clinicians with different levels of experience? Adv Health Sci Educ Theory Pract. 2014;19(1):43–51. doi.org/10.1007/s10459-013-9459-3
- 4.Samesima N, God EG, Kruse JCL, et al. Brazilian Society of Cardiology Guidelines on the Analysis and Issuance of Electrocardiographic Reports – 2022. Arq Bras Cardiol. 2022;119(4):638–680. doi.org/10.36660/abc.20220623
- 5.Postema PG, Wilde AAM. The measurement of the QT interval. Curr Cardiol Rev. 2014;10(3):287–294. doi.org/10.2174/1573403X10666140514103612
- 6.Mason JW, Hancock EW, Gettes LS. Recommendations for the standardization and interpretation of the electrocardiogram: part II: electrocardiography diagnostic statement list. Circulation. 2007;115(10):1325–1332. doi.org/10.1161/CIRCULATIONAHA.106.180201
- 7.Kligfield P, Gettes LS, Bailey JJ, et al. Recommendations for the standardization and interpretation of the electrocardiogram: part I: the electrocardiogram and its technology. Circulation. 2007;115(10):1306–1324. doi.org/10.1161/CIRCULATIONAHA.106.180200
- 8.Wagner P, Strodthoff N, Bousseljot RD, et al. PTB-XL, a large publicly available electrocardiography dataset. Sci Data. 2020;7(1):154. doi.org/10.1038/s41597-020-0495-6
This article is written for educational purposes only and is not a basis for clinical decisions. When treating a patient, rely on current clinical guidelines and the judgement of the responsible physician.
Tags
- how to read an ECG
- ECG interpretation
- 12-lead ECG
- ECG normal values
- QTc
- electrocardiography
About the author
MedIQ Editorial
Editorial team for medical education
MedIQ Editorial is the team of clinicians and medical-education specialists who prepare the platform's learning content. Articles are based on current clinical guidelines (WHO, FIGO, ACOG, RCOG, NICE, ESHRE) and peer-reviewed research; sources are listed at the end of every article.