Clinical practice · 7 min read
ECG measurements: heart rate, intervals, QTc and electrical axis
How to count the heart rate from the paper, measure PR, QRS and QT, calculate QTc with four formulas, see why Bazett misleads, find the axis and know the limits of voltage criteria.
- Published
In this article
The machine prints "QTc 516 ms" at a rate of 100/min. Dangerous prolongation, or a formula artefact? To answer, you need to understand QTc calculation and, before that, be able to measure rate, PR, QRS and QT from the paper yourself.
This post covers rate, intervals, the four QTc formulas, the axis and voltage criteria. Measuring is one step in reading an ECG systematically.
Heart rate: three methods
At the standard 25 mm/s, a small box (1 mm) is 40 ms and a large one (5 mm) 200 ms [1]. Always check the calibration: 1 mV = 10 mm [2]. In a regular rhythm, count the boxes between neighbouring R waves [1]:
| Method | Calculation | Best for |
|---|---|---|
| Large boxes | 300 ÷ large boxes | a quick estimate |
| Small boxes | 1500 ÷ small boxes | precision |
| Count the complexes | QRS in 10 s × 6 | irregular or slow rhythms |
If the next R wave falls 1, 2, 3, 4, 5 or 6 large boxes later, the rate is 300, 150, 100, 75, 60 or 50/min. In an irregular rhythm such as atrial fibrillation, a single RR interval misleads: multiply complexes in 10 s by 6 [1], or in 6 s by 10 [2]. A normal adult resting rate is 50–100/min [1].
Intervals: where to measure from and to
- PR interval: start of the P wave to start of the QRS; 120–200 ms in adults [2].
- QRS complex: first deflection to the J point; normal when under 120 ms in all leads [2].
- QT interval: start of the QRS to the end of the T wave [2].
Machines measure from the earliest onset to the latest offset across all twelve leads, so their P and QRS durations can exceed manual values [2].
QT is the hardest to measure, because the T wave returns to baseline gradually:
- Measure in lead II, where reference values were set [3], or in a lead with a T wave of at least 2 mm and a clear end [5].
- Draw a tangent to the steepest T downslope; where it meets the baseline is the end of T [3].
- Leave out a U wave clearly separate from T [3].
- Average the QT of three consecutive beats; skip an ectopic beat and the beat after it [3].
QTc calculation: four formulas and the Bazett error
QT shortens as the rate rises and lengthens as it falls, so it is rate-corrected before comparison with normal values; the result is the corrected QT interval (QTc) [3]. Four common formulas (QT in ms, RR in seconds, heart rate (HR) in beats per minute) [3][4]:
| Formula | Calculation |
|---|---|
| Bazett | QTc = QT ÷ √RR |
| Fridericia | QTc = QT ÷ ∛RR |
| Framingham | QTc = QT + 154 × (1 − RR) |
| Hodges | QTc = QT + 1.75 × (HR − 60) |
Bazett is widely used [2] but overestimates QTc at fast rates and underestimates it at slow ones [4], especially above 85/min according to the AHA/ACCF statement [5]. The 2022 Brazilian Society of Cardiology guideline advises the linear Framingham or Hodges formulas below 60 or above 90/min [2].
Vandenberk and colleagues compared five formulas in 6,609 patients at one Belgian hospital (sinus rhythm, QRS up to 120 ms, rate up to 90/min): Fridericia and Framingham corrected for rate best, while Bazett did worst and overstated the number of patients with dangerous prolongation. In a retrospective analysis of ECGs taken before a first dose of haloperidol, the best formula halved the number of patients classed as at risk [4].
Worked example: QT 400 ms at 100/min
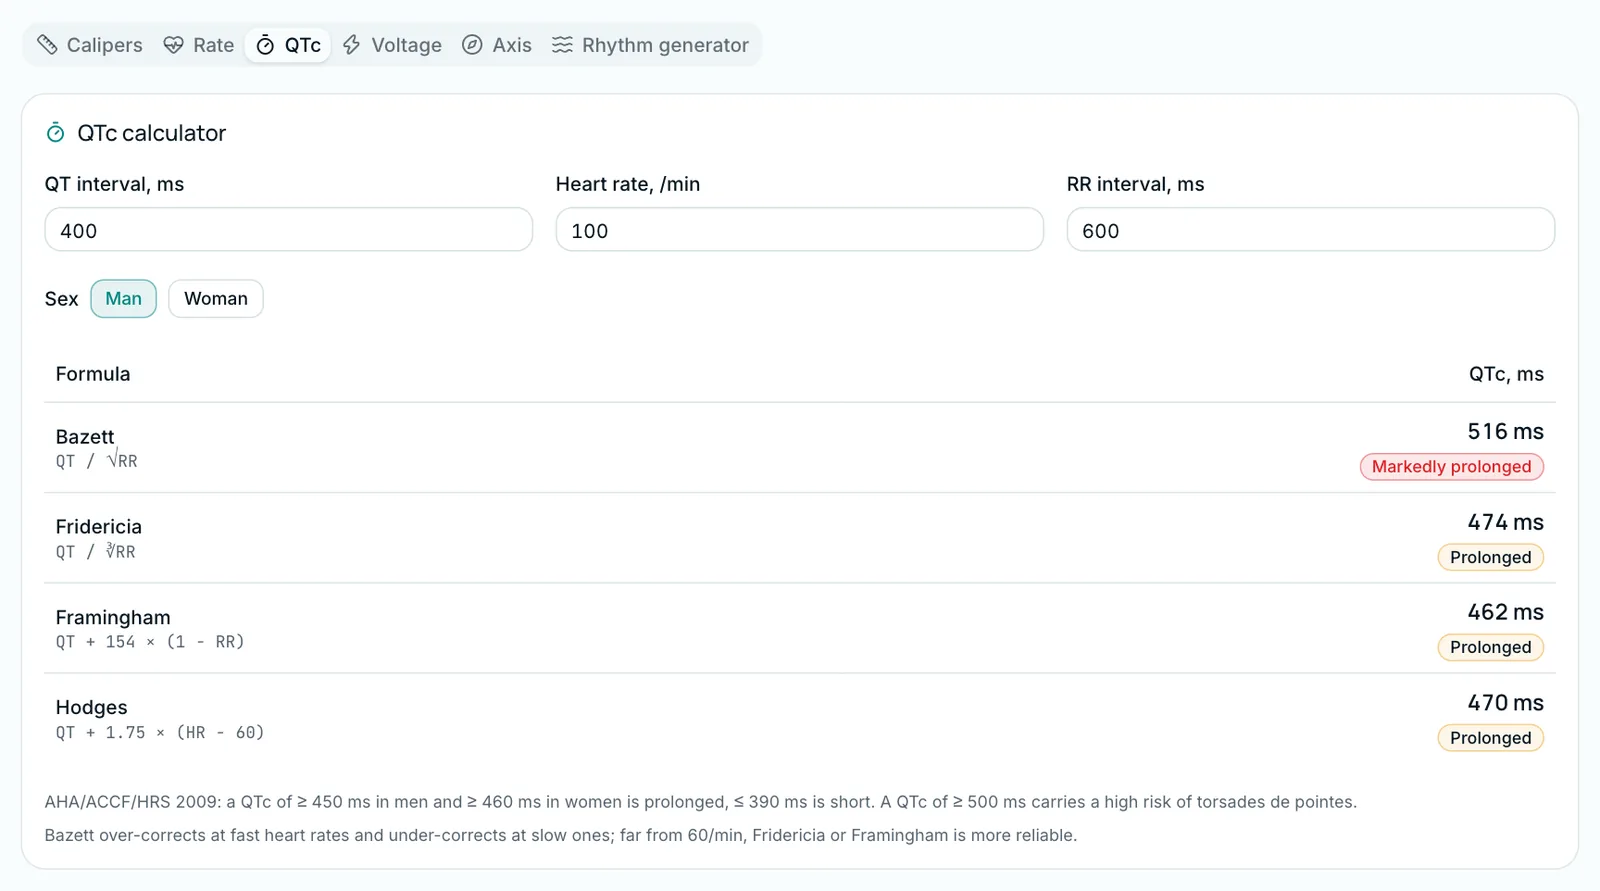
An invented teaching example of a man: in lead II, RR is 15 small boxes (rate = 1500 ÷ 15 = 100/min, RR = 600 ms) and QT is 10 small boxes (400 ms).
| Formula | QTc |
|---|---|
| Bazett | 400 ÷ √0.6 ≈ 516 ms |
| Fridericia | 400 ÷ ∛0.6 ≈ 474 ms |
| Framingham | 400 + 154 × 0.4 ≈ 462 ms |
| Hodges | 400 + 1.75 × 40 = 470 ms |
Bazett puts QTc above 500 ms; the others give 462–474 ms: for a man, prolonged by most thresholds, but under 500 ms. At this rate, rely on Fridericia, Framingham or Hodges rather than Bazett [2][3]. When a QTc looks abnormal, the first recommendation is to repeat the ECG [3].
At slow rates the error flips: QT 440 ms at 50/min gives 402 ms by Bazett, 414 ms by Fridericia, and 409 ms (Framingham) and 423 ms (Hodges) by the linear formulas, which the Brazilian guideline also advises below 60/min [2].
When is the QTc prolonged?
| Source | Men | Women |
|---|---|---|
| Population studies (Postema and Wilde) [3] | normal 350–450 ms | normal 360–460 ms |
| Brazilian guideline, 2022 [2] | normal up to 450 ms | normal up to 470 ms |
| AHA/ACCF, 2010 (99th percentile) [5] | prolonged: above 470 ms | prolonged: above 480 ms |
A QTc above 500 ms is markedly prolonged [5]. In congenital long QT syndrome it is associated with a 2- to 3-fold higher risk of torsades de pointes [5], and the threshold is also reasonable for acquired prolongation [3].
The MedIQ calculator names the source of its thresholds on screen (AHA/ACCF/HRS 2009): "Prolonged" from 450 ms in men and 460 ms in women, "Markedly prolonged" from 500 ms. These values match the upper limits of the population normal range in the table [3].
- Wide QRS. QT lengthening from a new bundle branch block does not mean acquired long QT; one method is to subtract the increase in QRS width [5].
- Atrial fibrillation. You can average the QTc after the shortest and the longest RR interval [5].
The electrical axis from leads I and aVF
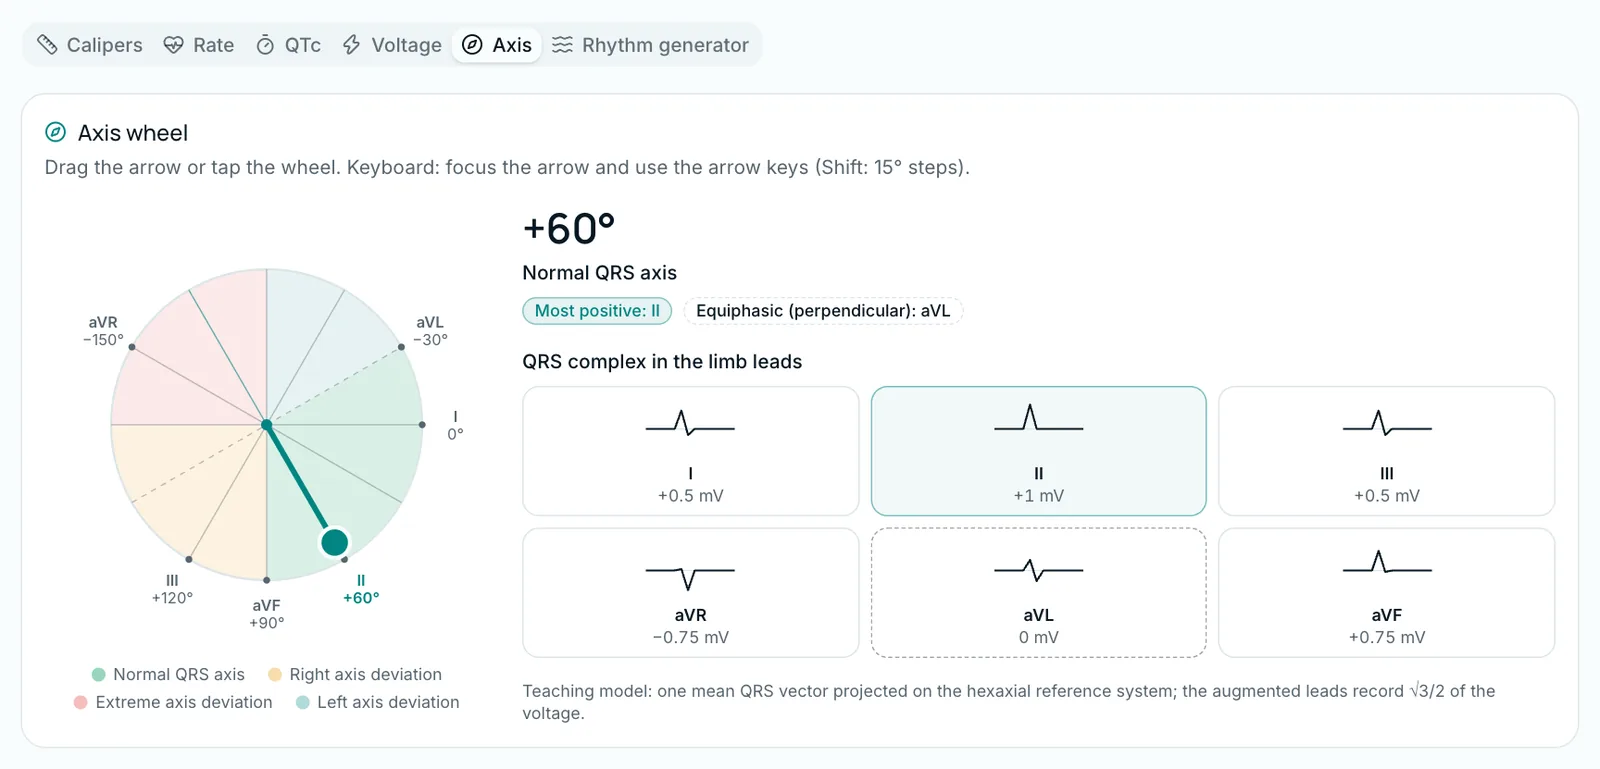
The normal adult QRS axis is −30° to +90° [2]. Beyond −30° is left axis deviation, beyond +90° right axis deviation, and −90° to 180° extreme deviation [6]. Quick method: the net QRS in I and aVF [6]:
| I | aVF | Axis | Meaning |
|---|---|---|---|
| + | + | 0° to +90° | normal |
| + | − | 0° to −90° | normal or left deviation: check II |
| − | + | +90° to +180° | right deviation |
| − | − | −90° to 180° | extreme deviation |
When I is positive and aVF negative, check lead II: it sits at +60°, so its perpendicular is −30°; a positive QRS in II means a normal axis, a negative one left axis deviation [6].
Voltage criteria and their limits
Two criteria in the calculator [2]:
- Sokolow–Lyon: S in V1 + R in V5 or V6 ≥ 35 mm (3.5 mV). In young people the cut-off may be 40 mm. In athletes the index should not be used on its own, because the guideline lists increased QRS voltage among normal athlete findings [2].
- Cornell: R in aVL + S in V3; cut-off 28 mm in men, 20 mm in women.
QRS voltage can be high without hypertrophy in young, slim and athletic people [2]. In a systematic review (21 studies, 5,608 hypertensive patients), a negative ECG barely lowered the probability of hypertrophy (from 33% to 31% with the Romhilt–Estes score in primary care), so ECG criteria should not be used to rule it out [7].
How to practise on MedIQ
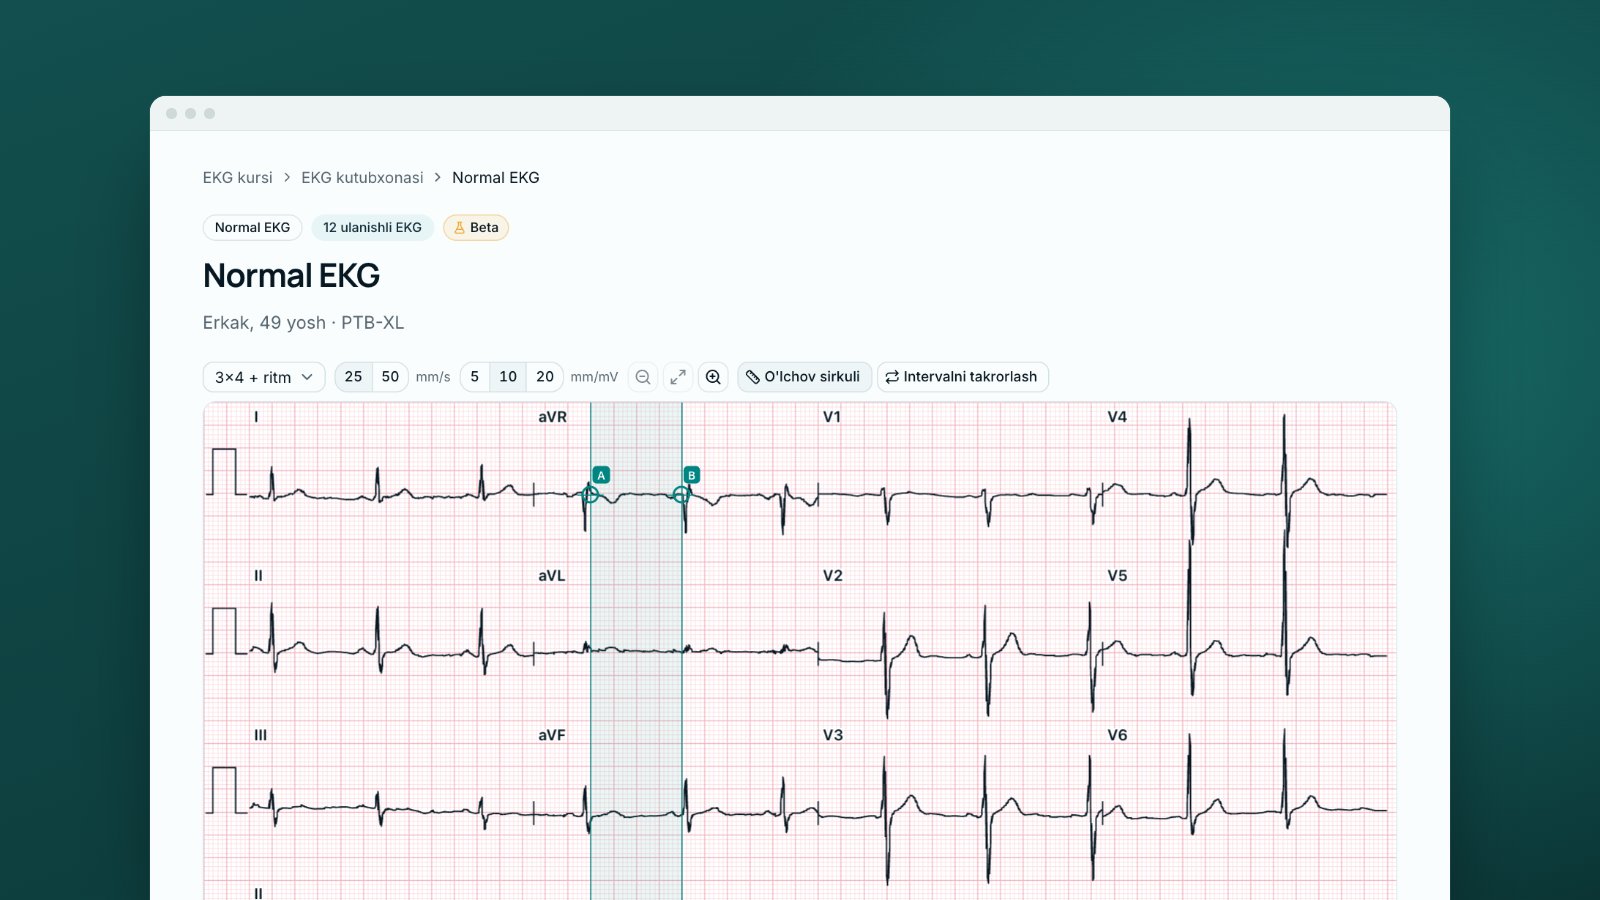
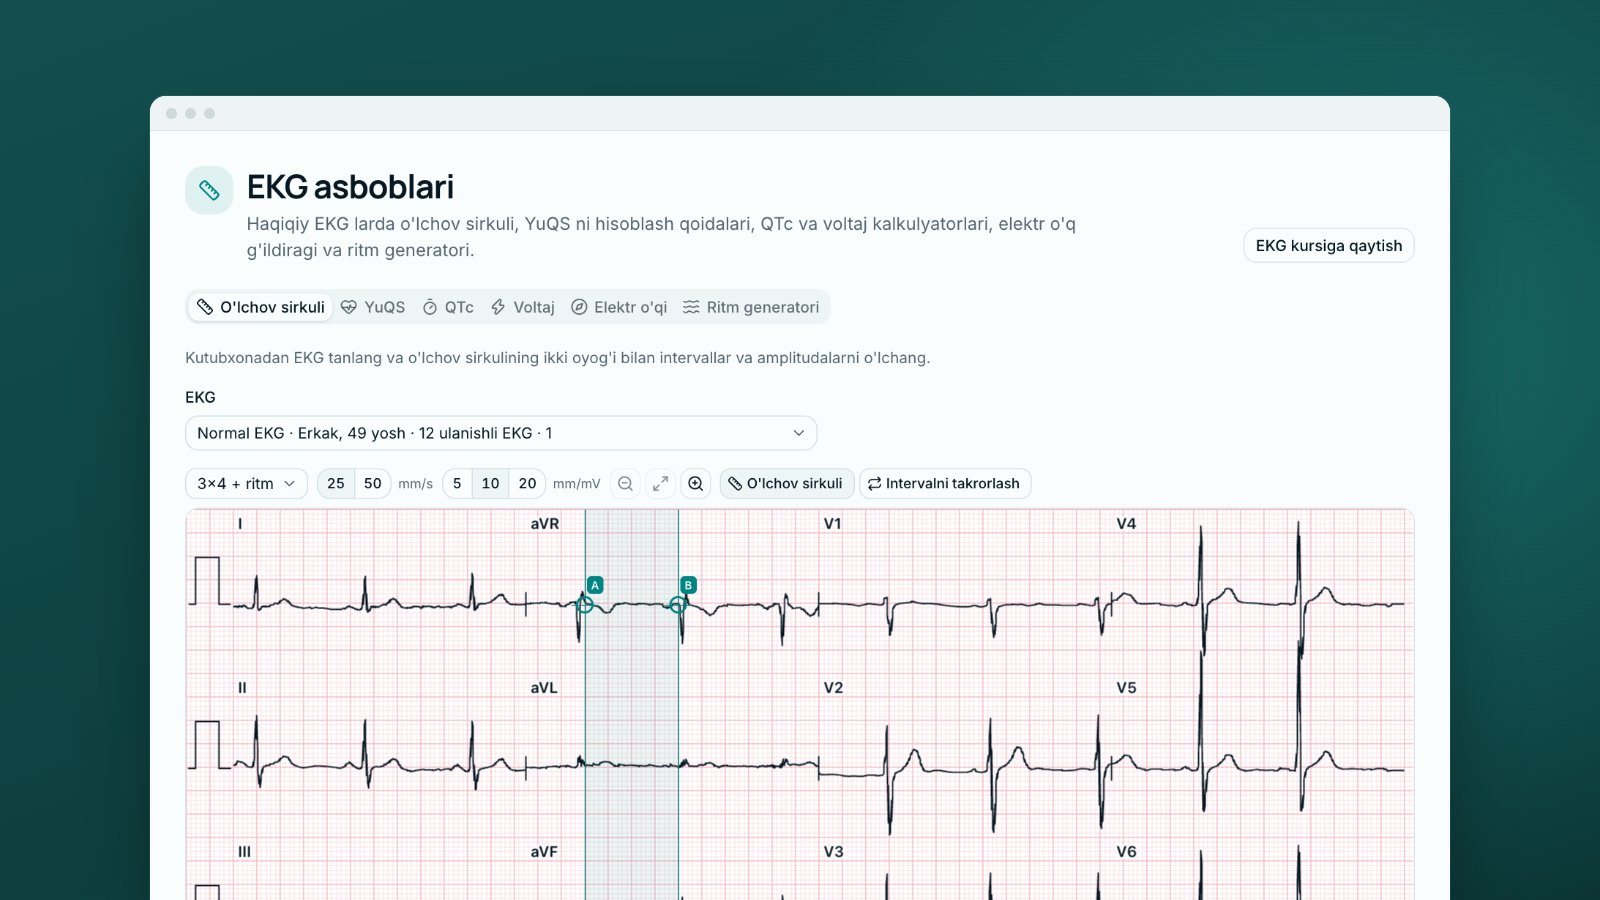
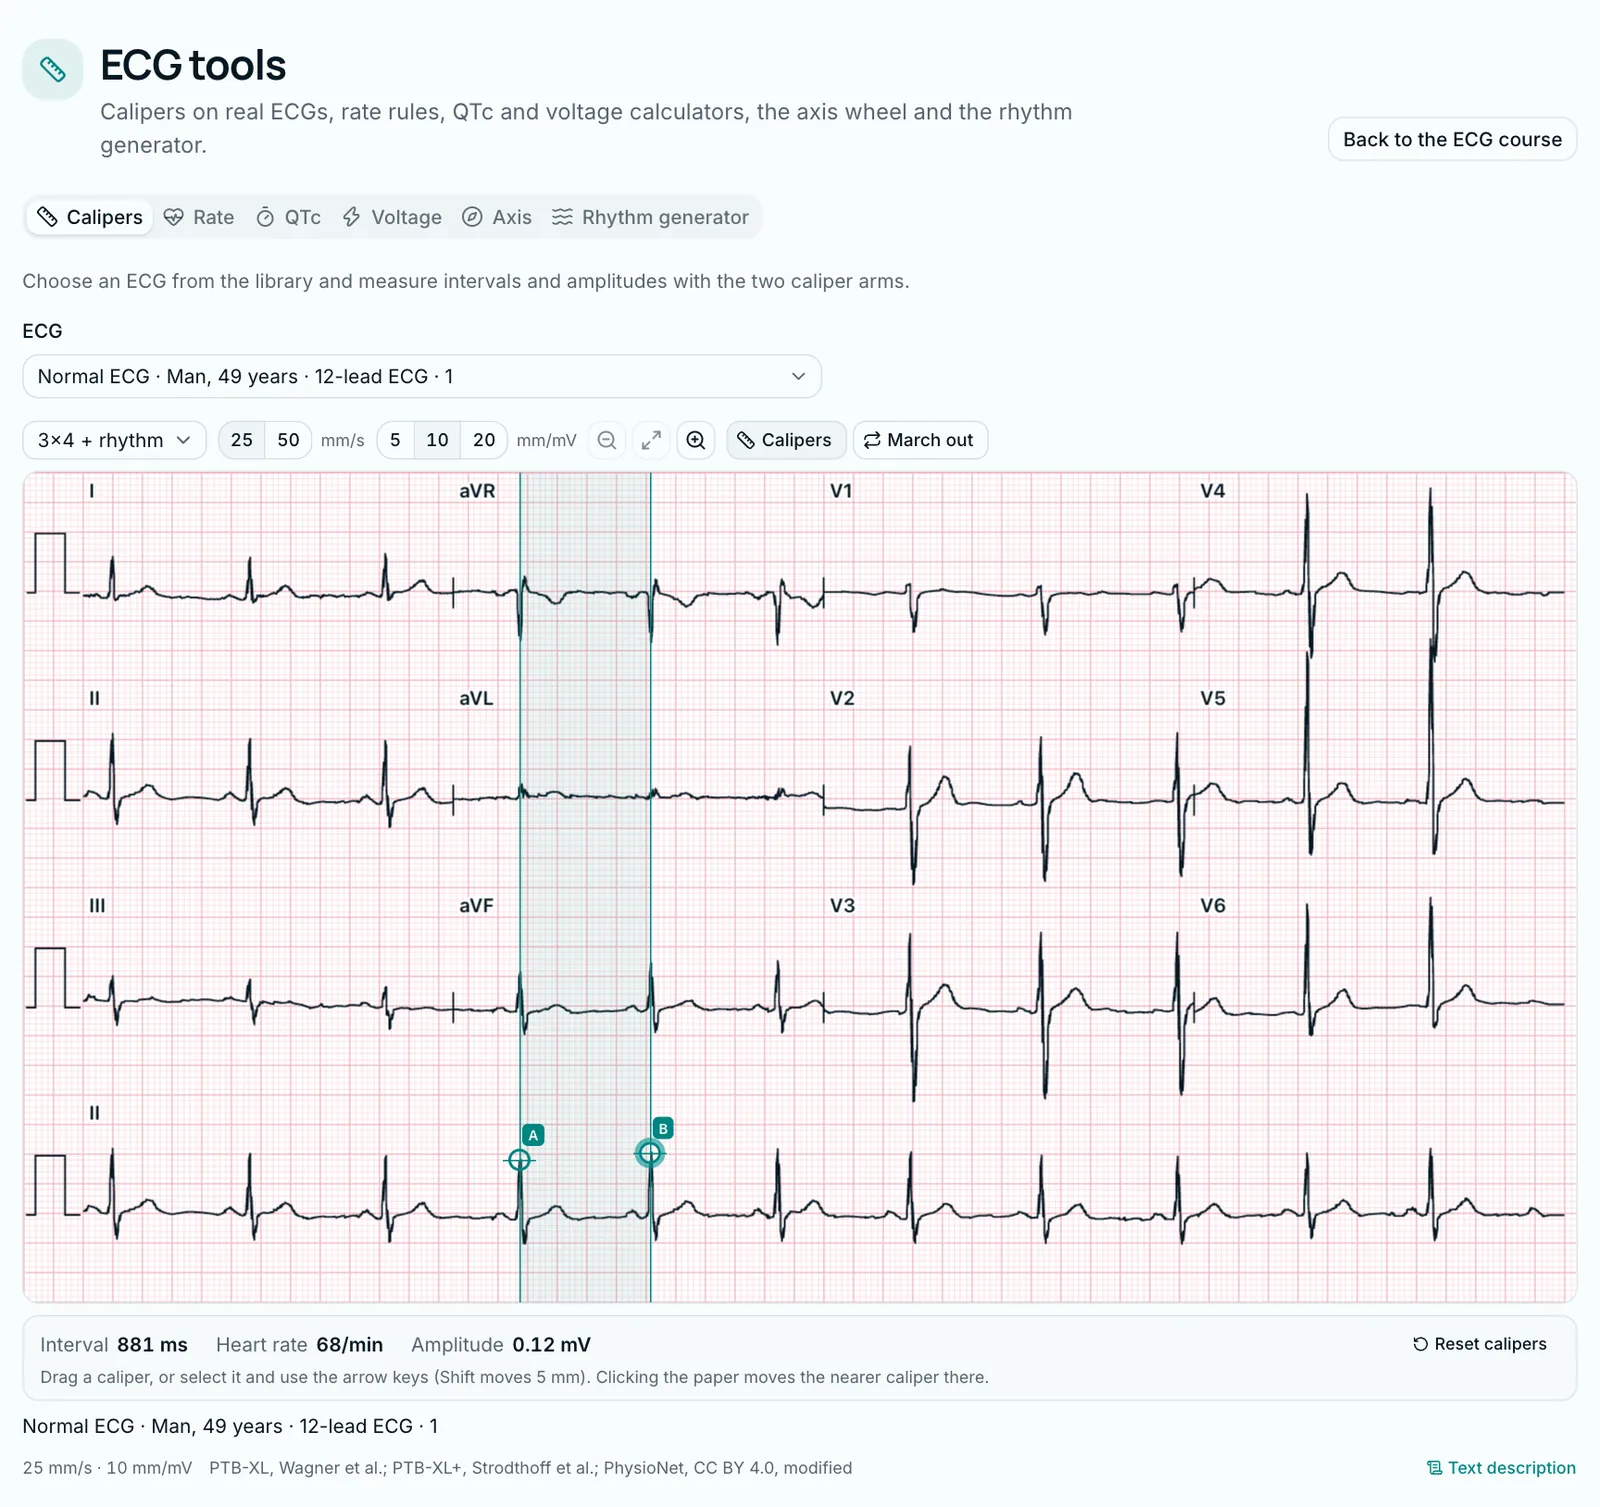
The "ECG tools" page has tabs for calipers, rate, QTc, voltage, axis and the rhythm generator.
- Calipers: on any of more than 30 annotated real ECGs, drag arms A and B to read the interval (ms), rate and amplitude (mV).
- QTc calculator: enter QT, rate or RR, and sex, and see all four formulas and their categories in one table.
- Axis and voltage: turn the vector on the axis wheel and watch the limb-lead QRS; test both criteria on the voltage tab.
Every library ECG shows the dataset's diagnosis and a "Measurements" card that names the method. For PTB-XL records these are automatic measurements (GE Marquette 12SL algorithm) with a Bazett QTc: on a fast-rate record, compare it with the Fridericia result in the calculator. Theory: lessons 9, 10, 12, 16 and 19 of "ECG fundamentals". The course is in Beta: checked by MedIQ AI, not yet by a physician. See the ECG course page and the course overview. This post is educational; clinical decisions follow local protocols and the responsible doctor.
Sources
- 1.Cadogan M, Buttner R. ECG rate interpretation. LITFL ECG Library. 2024. litfl.com/ecg-rate-interpretation/
- 2.Samesima N, God EG, Kruse JCL, et al. Brazilian Society of Cardiology Guidelines on the Analysis and Issuance of Electrocardiographic Reports – 2022. Arq Bras Cardiol. 2022;119(4):638–680. Erratum: Arq Bras Cardiol. 2022;119(6):1008. doi.org/10.36660/abc.20220623
- 3.Postema PG, Wilde AAM. The measurement of the QT interval. Curr Cardiol Rev. 2014;10(3):287–294. doi.org/10.2174/1573403X10666140514103612
- 4.Vandenberk B, Vandael E, Robyns T, et al. Which QT correction formulae to use for QT monitoring? J Am Heart Assoc. 2016;5(6):e003264. doi.org/10.1161/JAHA.116.003264
- 5.Drew BJ, Ackerman MJ, Funk M, et al. Prevention of torsade de pointes in hospital settings: a scientific statement from the American Heart Association and the American College of Cardiology Foundation. Circulation. 2010;121(8):1047–1060. doi.org/10.1161/CIRCULATIONAHA.109.192704
- 6.Cadogan M, Buttner R. ECG axis interpretation. LITFL ECG Library. 2024. litfl.com/ecg-axis-interpretation/
- 7.Pewsner D, Jüni P, Egger M, et al. Accuracy of electrocardiography in diagnosis of left ventricular hypertrophy in arterial hypertension: systematic review. BMJ. 2007;335(7622):711. doi.org/10.1136/bmj.39276.636354.AE
This article is written for educational purposes only and is not a basis for clinical decisions. When treating a patient, rely on current clinical guidelines and the judgement of the responsible physician.
Tags
- QTc calculation
- ECG measurements
- heart rate
- QT interval
- electrical axis
- left ventricular hypertrophy
- ECG course
About the author
MedIQ Editorial
Editorial team for medical education
MedIQ Editorial is the team of clinicians and medical-education specialists who prepare the platform's learning content. Articles are based on current clinical guidelines (WHO, FIGO, ACOG, RCOG, NICE, ESHRE) and peer-reviewed research; sources are listed at the end of every article.